Annual Disability Status Reports
Download national and state-level reports presenting prevalence and relative economic status of people with disabilities.

Easily create and save maps, charts, and tables of national, state, and local disability statistics
Go To Stats!Download national and state-level reports presenting prevalence and relative economic status of people with disabilities.
DisabilityStatistics.org provides custom estimates calculated by Cornell University and estimates from tables generated by the Census Bureau.
ACS Custom 1-Year Estimates are generated by the Yang-Tan Institute on Employment and Disability at Cornell University using the 1-year ACS Public Use Microdata Sample (PUMS) data.
ACS Census 5-Year Estimates are based on estimates from tables generated by the Census Bureau. These estimates are based on data compiled over a 5-year period, that is, the 2023 5-year Estimates use data collected from 2018 to 2023.
Display stats your way. Choose from multiple visualization types, including choropleth maps, bar charts, tables, and summary text.
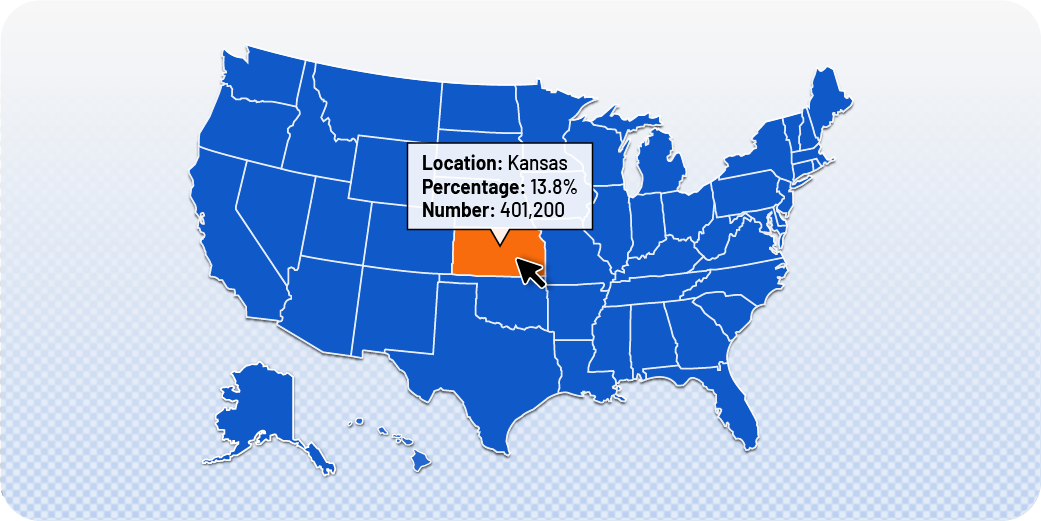
Display disability statistics by county, congressional district, or state. Pan, zoom, and view details on demand. Filter by form or histogram to specify the data you need.
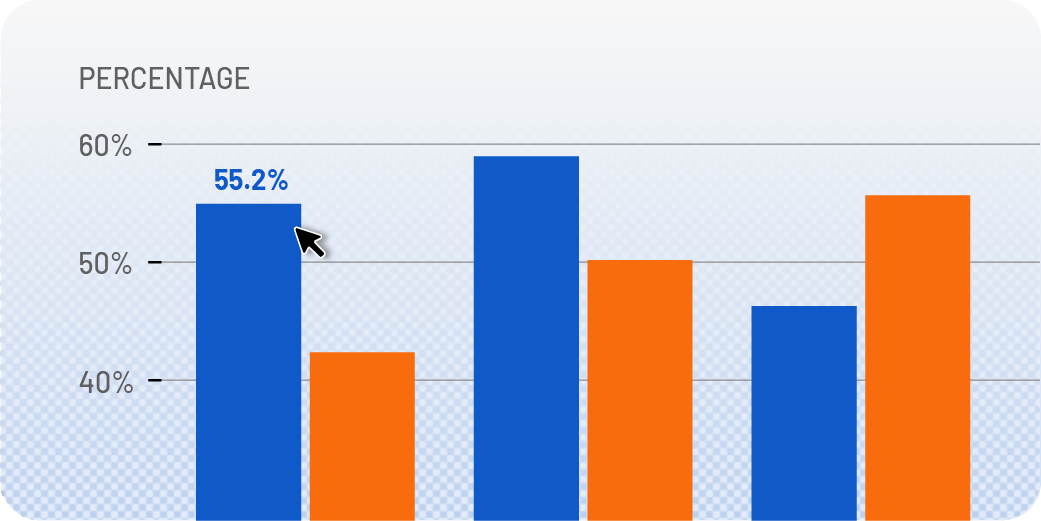
Customize charts to view statistics by disability type, race, sex, or education for selected counties, congressional districts, or states.
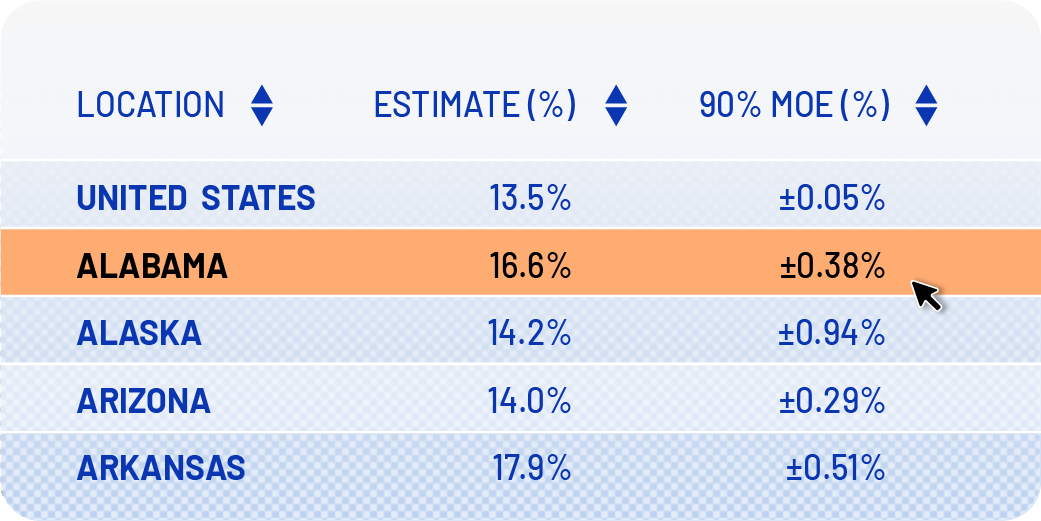
All map and chart data are available in accessible tabular format. Sort and customize column views to get the table you need.
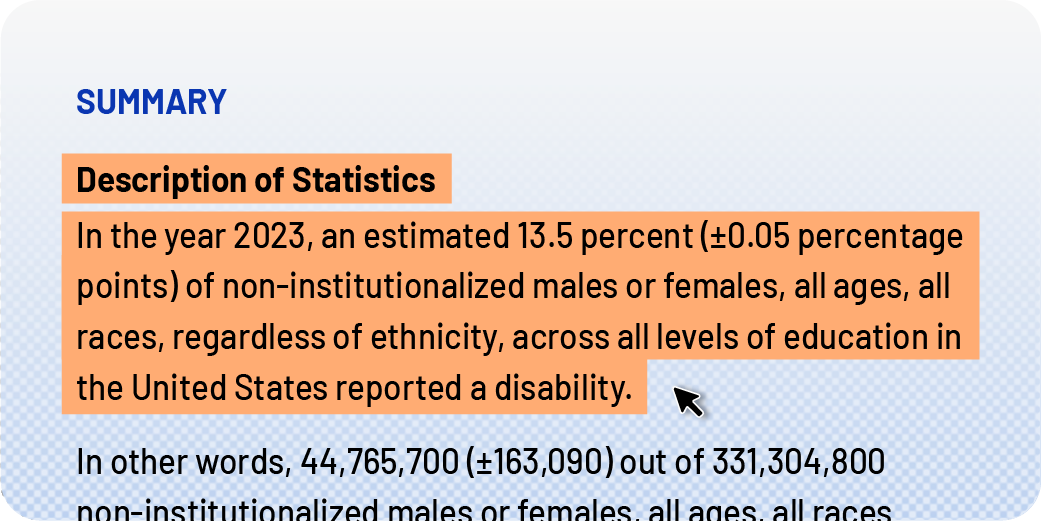
Need help writing about the statistics you’ve selected? Select and copy descriptive text for your reports and grants!

Create an account on DisabilityStatistics.org to ask our researchers your disability data questions and sign up for our mailing list to get updates on new site features and data.
Create AccountAlready have an account? SIGN IN